The Department of Ecosystems and Conservation (DEC) of the Sokoine University of Agriculture (SUA) is aimed to equip M.Sc Forestry, M.Sc Agroforestry, M.Sc Ecosystem Science and Management, and PhD students with best Remote Sensing and GIS-based analysis for land cover change assessment.
The CONTAN project organized training on Remote Sensing and GIS at the Sokoine University of Agriculture (SUA). Pekka Hurskainen from Finland visited us for three days training on “Remote Sensing and GIS-based analysis for land cover change assessment” as part of the ERASMUS+ program. The training is aimed to equip the students with practical knowledge on the use of Remote Sensing and GIS-based analysis for land cover change assessment.
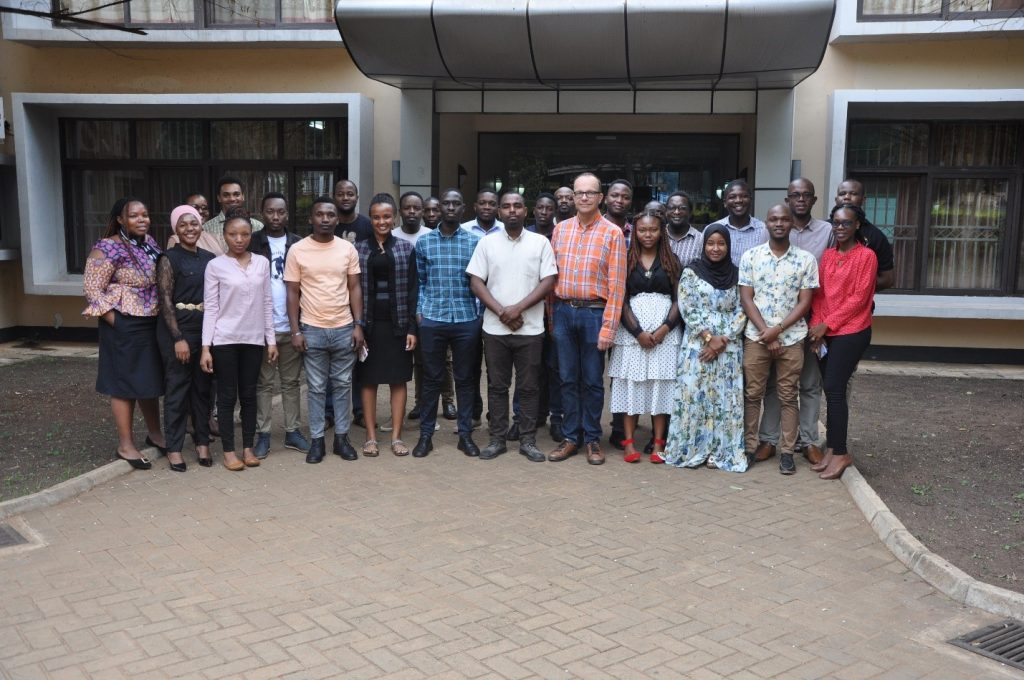
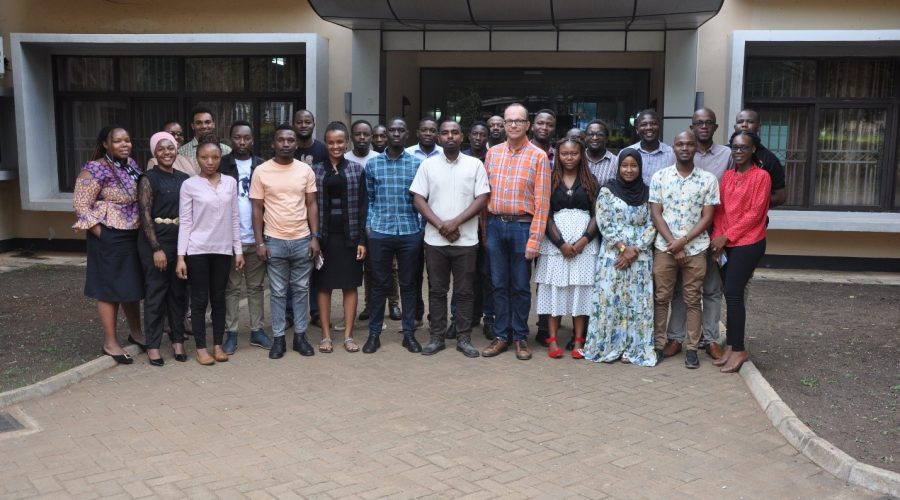
Group photo of M.Sc Forestry, M.Sc Agroforestry, M.Sc Ecosystem Science and Management, PhD students and Pekka Hurskainen
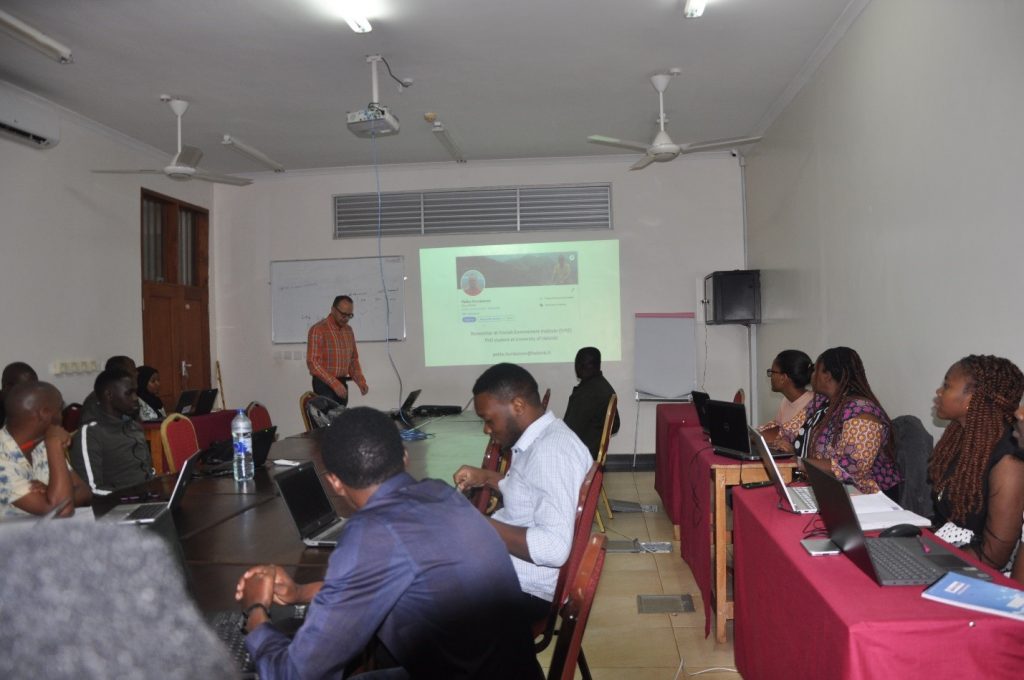 Masters’ students in Forestry and Ecosystem science and management, attending a three days training on “Remote Sensing and GIS-based analysis for land cover change assessment”.
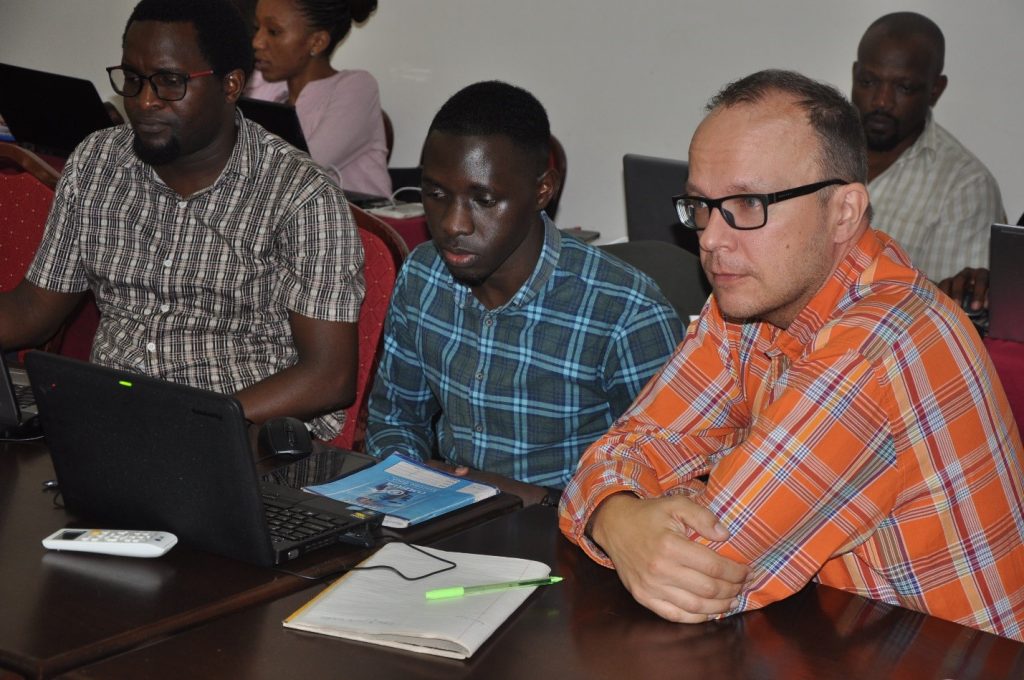
Interactive learning of students in learning about “Land cover change assessment”, through Bitemporal Visual Change Detection, Supervised Classification and Post-Classification Change Detection
For more information, please contact;
Dr. Charles J. Kilawe
Contact Person at Sokoine University of Agriculture
Department of Ecosystems and Conservation,
PO Box 3010, Chuo Kikuu, Morogoro, Tanzania
ckilawe@sua.ac.tz
+255 752 581 069
About the CONTAN project
Frequently asked questions
What is land use and land cover in GIS?
Land Use / Land Cover (LULC) generally refers to the categorization or classification of human activities and natural elements on the landscape within a specific time frame based on established scientific and statistical methods of analysis of appropriate source materials.
What’s the difference between land use and land cover?
Land cover data documents how much of a region is covered by forests, wetlands, impervious surfaces, agriculture, and other land and water types. Water types include wetlands or open water. Land use shows how people use the landscape – whether for development, conservation, or mixed uses. The different types of land cover can be managed or used quite differently.
Land cover can be determined by analyzing satellite and aerial imagery. Land use cannot be determined from satellite imagery. Land cover maps provide information to help managers best understand the current landscape. To see change over time, land cover maps for several different years are needed. With this information, managers can evaluate past management decisions as well as gain insight into the possible effects of their current decisions before they are implemented.
What causes changes in land cover?
Population pressure, demand for fuel wood and construction material, agricultural expansion and policy and tenure insecurity were the major driving forces behind the land use/cover change.
What are the application of remote sensing in land use land cover?
Land use applications of remote sensing include the following: natural resource management. wildlife habitat protection. baseline mapping for GIS input.
What is land cover change detection?
Land use land cover (LULC) change detection based on remote sensing data is an important source of information for various decision support systems. Information derived from land use and land cover change detection is important to land conservation, sustainable development, and management of water resources.
What is land cover classification in remote sensing?
Classification in remote sensing involves clustering the pixels of an image into a (relatively small) set of classes, such that pixels in the same class are having similar properties. The majority of image classification is based on the detection of the spectral response patterns of land cover classes.
What is land cover analysis?
Land use/land cover analysis: The changes in the land use/land cover patterns due to the project activity involving changes in land terrain like cutting of high grounds and hillocks, filling of low-lying areas, and reclamation affecting drainage patterns need to be brought out.
How is GIS used in land use planning?
For the purposes of land use GIS allow using data of remote sensing, which allows making monitoring of anthropogenic influence in a particular area and estimating scales and rates of degradation of green cover, flora, and fauna.
How does remote sensing help in the study of land use change?
The primary role of remote sensing in land management and planning has been to provide information concerning the physical characteristics of the land which influence the management of individual land parcels or the allocation of lands to various uses.
Why is it important to study land use change?
It is possible to establish a model to predict the trends in land uses in a certain period of time through the study of past land use changes, which could provide some basis for scientific and effective land use planning, management, and ecological restoration in a study area and guidance for regional socio-economic.
What is change detection analysis?
Change Detection Analysis encompasses a broad range of methods used to identify, describe, and quantify differences between images of the same scene at different times or under different conditions.
What is accuracy assessment in remote sensing?
Accuracy assessments essentially determine the quality of the information derived from remotely sensed data. These assessments can either be qualitative or quantitative. Qualitative is usually a quick comparison to see if the remote sensed data or map “looks right” and corresponds to what is on the ground.
How remote sensing images can be used in land use analysis?
Remote sensing via satellite imagery is an excellent tool to study LULCC because images can cover large geographic extents and have high temporal coverage. Remote sensing is also used to investigate historical LULCC and also provide data (e.g. ground truth) in areas that are inaccessible.
What is accuracy assessment GIS?
Accuracy Assessment uses a Reference Dataset to determine the accuracy of your classified result. The values of your reference dataset need to match the schema. Reference data can be in several different formats: A raster dataset that is a classified image. A polygon feature class or a shapefile.
How do you calculate accuracy assessment?
To calculate the percent accuracy, divide your total correct reference points by your total “true” reference points and multiply this by 100,

