By Americo Manjate
PhD student under REFOREST Programme at Sokoine University of Agriculture
Miombo is one of the most extensive forest formations in Africa. Due to its resilience, this ecosystem has become the basis of subsistence for about 100 million people who live in the regions where it occurs, even in presence of agriculture and cattle raising. This led to the increasing exploitation of Miombo. Other source of Miombo over exploitation, are the increasing human and livestock populations, as well as the concentration of wildlife herbivores into small conservation areas. These facts leads to their degradation, deforestation, and reduction of its extension. This evident degradation and reduction, combined with the recognition of its importance for the environment and biodiversity, led to efforts to protect it.
In Mozambique the scenario is the same. So, even Mozambique has a vast forest heritage, because two thirds of it is Miombo (MITADER, 2018; World Bank, 2017), it supports 70 percent of its population as source of food, energy and income (MITADER, 2018), therefore, the forest cover in Mozambique that was about 51 percent (World Bank, 2017) of the territory are currently updated to 40% (Aquino et al., 2018), and even the rate of deforestation in the country has increased from 0.58 percent per year (World Bank, 2017) to 0.79 percent per year (Aquino et al., 2018). To reverse this scenario, forest management with intensive silviculture must be adopted.
However, forest management in Mozambique has limited adoption of silvicultural practices. Among the aspects that contribute to this scenario are the legal aspects such as the adoption of the minimum cutting diameter and selective cutting, which prevent the adoption of silvicultural practices, as the logging of individuals with small diameters, and the opening of clearings, in a context in which, the most valuable species of Miombo, in order to have abundant regeneration and high growth rates, require wide gaps. In addition, the belief that the ecology of the region and its environment determine an immutable low average annual growth rate of trees, and makes investors believe that investment in forestry is unfeasible. Finally, there is the fact that although all are considered Miombo, there are “different Miombo” in the region, each with specific and differentiated responses to different interventions.

Figure 2: Miombo socio-ecological management
In this scenario, it becomes relevant to understand; first, whether the limitations (ecological or not), effectively make silvicultural interventions unfeasible. Second, identify which silviculture interventions can increase the growth and quality of raw material, increasing the value and availability of raw material ensuring its profitability. Third, it is important to have accurate forecast in the growth and yields of forest. Finally, in what extent legal changes that would potentially promote the increase in silvicultural interventions would be beneficial to the productivity and profitability of these ecosystems. It is in this context that the present work was developed, which focused on the design of an silviculture experiment that aims to understand which silvicultural interventions are most appropriate for the Miombo forest of the Company Levasflor, improving the ability and quality of forecast in the growth, yields and characteristics of the harvested trees in the stem and in its different classes of branches.
For this purpose, based on a bibliographic review and consultation with specialists working with Miombo, it was established that, the availability of light in the lowest stand’s level, competition among seedlings and saplings, and fire; were selected as the main factors that determine the sustainability of these stands. Thus, to manipulate the amount of light that reaches the lowest stratum of the stand, differents gap sizes were established, namely, two gaps of 45m and 75m of diameter each, and others gaps of lower sizes than these ones. These lower gaps, that will not be measured its size, will be stablished by the selective cut. It should be noted at this point that the size of the gaps affects the distance between plants and consequently the competition between them for resources and space. For fire, three levels of fire management were defined. The different levels of fire management were achieved, manipulating the existence and size of firebreaks, remotion or not of dead wood material and also using or not the early burning practice. Thus, the experiment was arranged in three blocks, where each block represents one of the three levels of fire management. Therefore, block I represents the highest level of management, block II the intermediate level and block III the lowest level. It is important to point out that for many, fire (which is generally anthropogenic) is the main disturbing factor in the Miombo.
In terms of firebreaks, were established around Blocks I and II, while none were established in Block III. The firebreak in Block I is a permanent firebreak of 10m wide, while the one in Block II was a non-permanent and had a width of 1m. Block I have 14 plots, while the remaining blocks have 10 plots each. Inasmuch as each plot has an area of 1ha, block I has 14ha, Blocks II and III have 10ha each and in total the experiment has an area of 34ha.
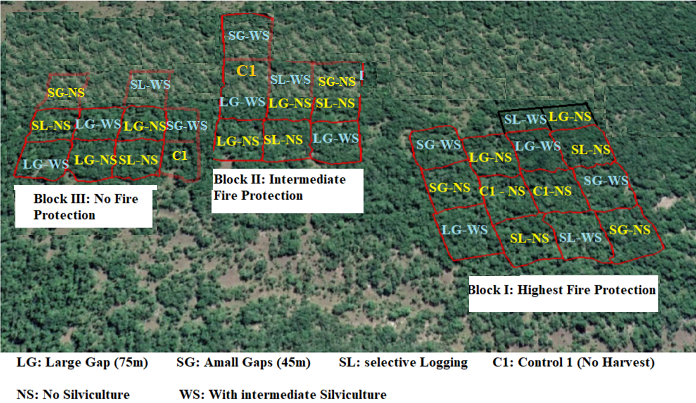
Figure 3: Lay-out of experiment
In the experiment seven treatments will be compared namely; Control (plot left without any treatment), selective logging with intermediate silvicultural intervention, selective logging without silvicultural intervention, gap of 75m of diameter without silvicultural intervention, gap of 75m with intermediate silvicultural intervention, gap of 45m of diameter without silvicultural intervention , gap of 45m with intermediate silvicultural intervention. Block I have two plots of each treatment, while in Blocks II and III, some treatments only have one plot. These treatments will be compared in terms of average annual growth of individuals, costs of silvicultural interventions, revenues obtained and consequently their profits. For it, the forecast about growth and yield as well as, the market trend will be used to create different scenarios. In these scenarios, this analysis will combine the costs, revenues, and profits in different years, according to the market and forest trends. For this analysis, the present value will be used. For temporal equivalence, after accounting for cost and prior revenue will be discounted to the same base representing the present value of the investment. The capital budgeting criteria for forestry investments is the net present value.
To obtain the data on the average annual increment of individuals in different years, individuals submitted to different treatments will have their diameters measured in different years and the difference in diameters found in consecutive years will represent the annual increment. Identification plates was placed on each individual, in order to guarantee that the data of the different measurements manipulated for the calculation of the average annual increment come from the same individual.
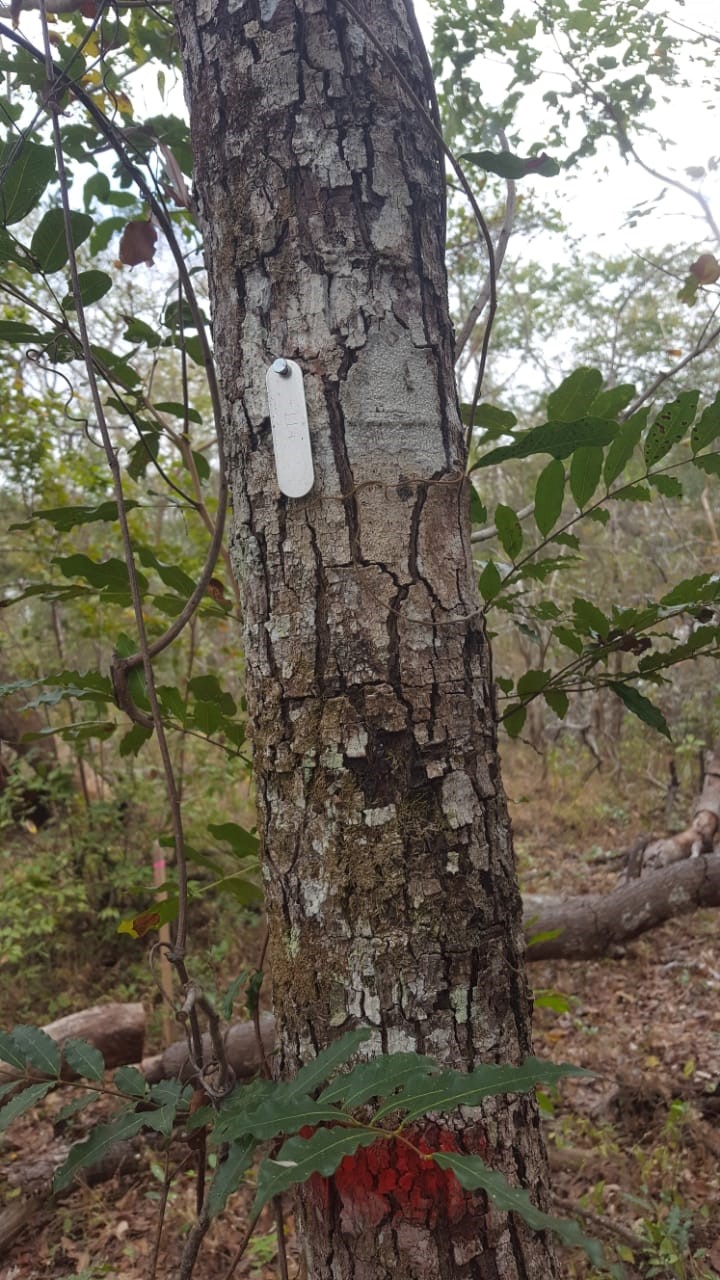
Figure 4: Identification plate
So far, an inventory (the first) has been carried out, in which, after establishing the parcels and blocks, the following data has been collected. For trees with DBH ≥ 10 cm (total and commercial height, DBH, specie, stem and crown quality. For each tree, of these its geographical coordinates were marked by GPS. The regeneration was measured in two subplots. The regeneration was subdivided into two classes, with the following measurements taken by regeneration class, regeneration with diameters between 5-10cm (DBH and specie identification), for regeneration with a diameter below 5cm, te individuals were only identified by species and counted.
Costs will be determined for each activity (gap establishment, selective cutting, sanitary cutting, release cutting, dead wood removal, fire break establishment, removal of fallen wood from the plot, early burn, firebreak establishment and maintenance, coppice reduction and thinning), that occurs on each treatment throughout the cutting cycle. Data required to determine the costs of silvicultural interventions are labor, machinery, equipment and consumables involved in the activities describied before. The revenue for each treatment will be obtained by measuring the total volume of marketable wood obtained by each silvicultural intervention, being this wood multiplied by its respective market price, taking into account the species and quality. So far, the interventions that generated quantified wood were opening clearings (45m and 75m), selective cutting, liberation cutting and setting up a firebreak. The monetary value of this wood will be obtained by multiplying its volume by its market price.
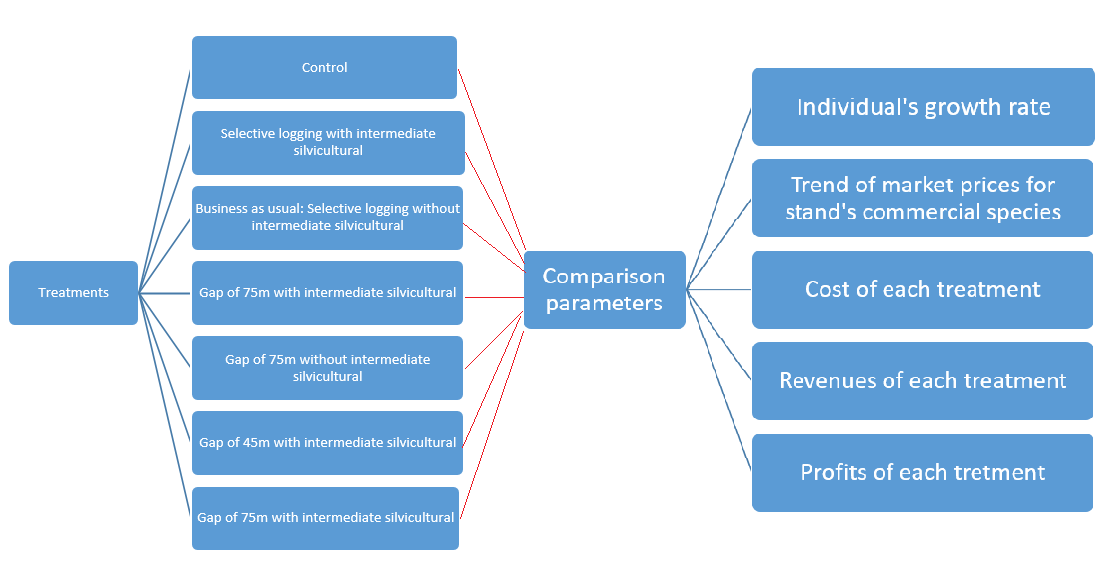
Figure 5: Experiment, its treatments and treatment comparison parameters
On the other hand, in order to make possible to accurately predict the total volume of the tree and to predict the distribution of this volume along the trunk and branches of different diameters and branching category (first, second and others), equations that relate DBH, height and density with crown dimension, volume of whole tree (stem, branches), heartwood and sapwood will be developed for the two most abundant species namely Brachystegia spiciformis and Julbernadia globiflora; and for the three most commercially valuable species today namely Afzelia quanzensis, Pterocarpus angolensis and Millettia stuhlmannii.
To develop equations, the samples were selected, being focused in individuals without observable defects, abnormalities and diseases. The following seven diameter classes were established based on DBH; 10-20cm; 20-30cm, 30-40cm, 40-50cm, 50-60cm, 60-70cm and 70-80cm. Four individuals per specie were sampled per diameter class. Thus, a total of 28 individuals were sampled per species and the total for all species will be 140. The process of tree felling still on going.
Once selected, the canopy dimeter and the DBH are measured and the tree was cut at stump height (at 30 cm from the ground). The tree is subdivided into stem and branches. After that, each tree is measured its commercial and total height (hc and Ht). For all species, the branches are categorized into primary, secondary and others taking into account, if it is a branch that results from the first, second or another level of branching. Trees are measured before and after sectioning. Before being sectioned, all trees are measured its diameter of stem and branches with bark at the heights of 0.3, 0.8, 1.3, 1.8m, 2.0m and thereafter at each 1m, if its diameter still equal or above to 10 cm, at these points. For the final length of the stem or branch with less than 1m, it is measured in its total length if its whole length has at least 10 cm in diameter, if not, it will be measured until its point of diameter of at least 10 cm. Therefore, the measurements is made until diameter still greater or equal to 10cm. All the measured points will be marked, because some of them, are the points at which the stem and/or branch will be cut.
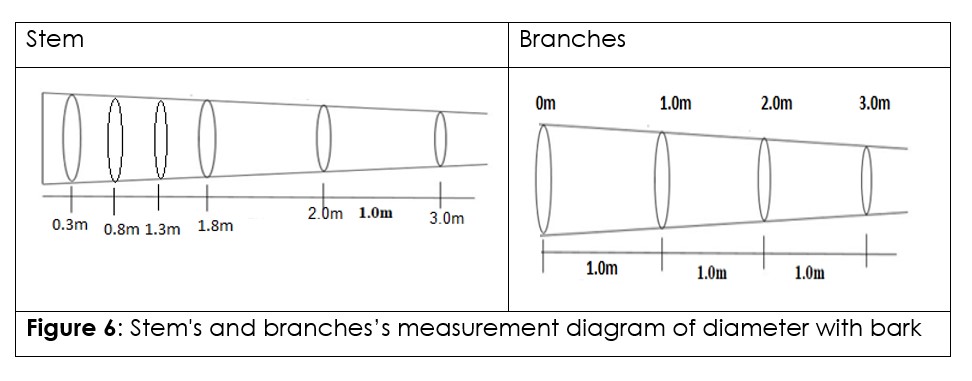
Figure 6: Stem’s and branches’s measurement diagram of diameter with bark
The sectioned stems at the points previously marked, when measuring with bark, in multiple heights of 3m, and the branches in multiples of 2m. In these sections, after its sectioning, the diameters without bark and the diameter of the heartwood will be measured. So, at these points, the recorded data are the diameters with and without bark, as well as the diameter of the heartwood.
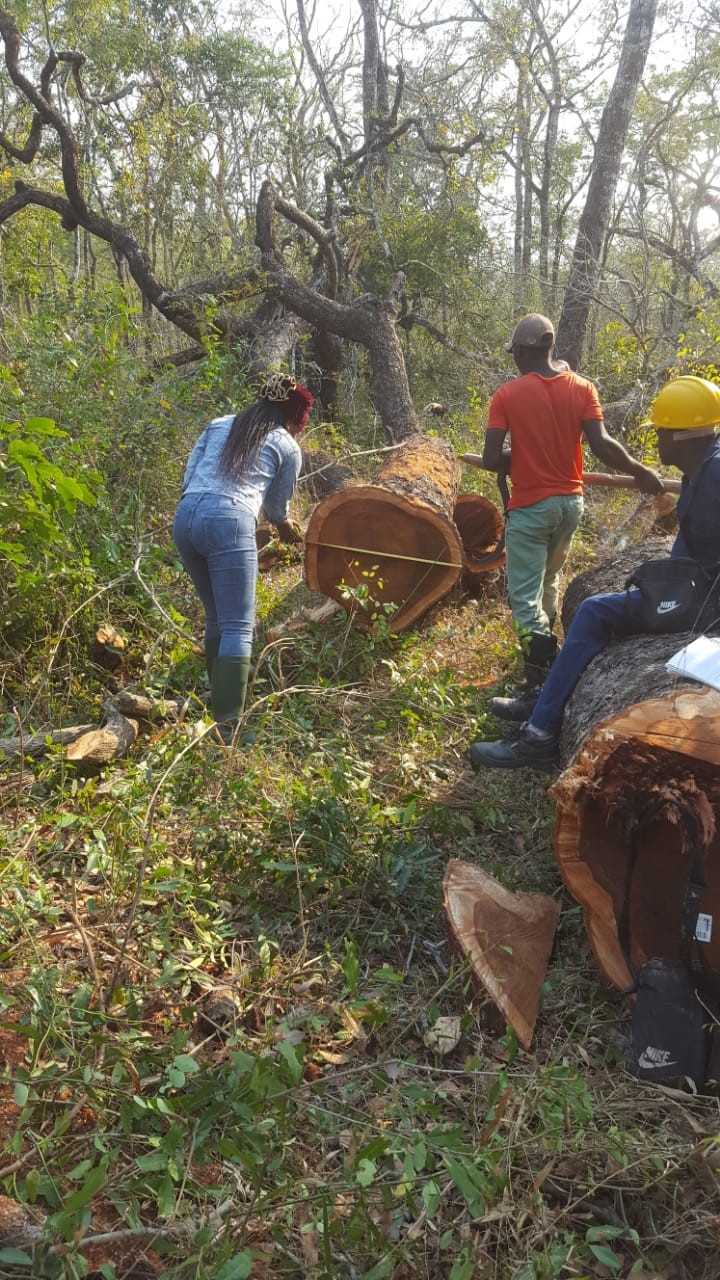
Figure 7: Heartwood measurement
Using the data collected (diameters and length, with and without bark as well as the diameter of hearwood) the volume of each log with and without bark and the volume of its heartwood will be determined. The cumulative volume, for each of the last volume by tree, will be determined by summing all sections.
The data collected will be used to develop a model. The model will have one of the following variables as dependent variable; the total volume, stem volume, hearwood volume, crown volume, volume of the first branches, volume of the second branches and the volume of the other branches and as an explanatory variable will have at least one of the following variables DBH, commercial and total heights as well as the crown’s length. Depending on the data profile, it can be composed of only a single equation, two (one for the stem component below the DAP and another for the component above the DAP), or it can be composed by three equations according to the three solids that best conform to the shape of the bole.
Until now, the present study has reinforced my conviction of its relevance because Miombo is a rich, diversified, complex and fundamental ecosystem for satisfying the daily needs of the populations around it and for the country’s economic development. However, to reach its potential contribution to sustainable development, in addition to the knowledgement of its ecology, understanding its social dimension is fundamental. In this context, research such as this one has the potential to generate relevant knowledge in terms of silviculture interventions that can help to achieve these goals.This knowledge will allow the better selection of silviculture interventions that can increase the growth and quality of raw material, increasing the value and availability of it. On top of that, is expected that it, enhance the ability and quality of forecast in the growth and yields of forest as well as in the estimation of the volume, size and quality of wood in a given stand at a given point of time. Good forecast and estimate, can improve the efficiency on use of the available timber over time. These aspects are important, as they reconcile actions that lead to the sustainability of the forest and the profitability in the sector so it can be self-sustainable. The conciliation of these objectives based on the sector’s own income is essential to allow this sustainable model to be replicated efficiently and consequently scalable.
REFERENCES
Aquino, A., Lim, C., Kaechele, K., & Taquidir, M. (2018). Mozambique Country Forestry Note. Mozambique Country Forestry Note.
MITADER. (2018). Desflorestamento em Moçambique (2003 – 2016).
World Bank. (2017). The strategic climate fund to the Republic of Mozambique for the Mozambique forest investment project.
